
Tags
Arctic, Arctic warming, climate change, Cold weather, global circulation, global warming, Russia, temperature extremes, warm weather, warm winters
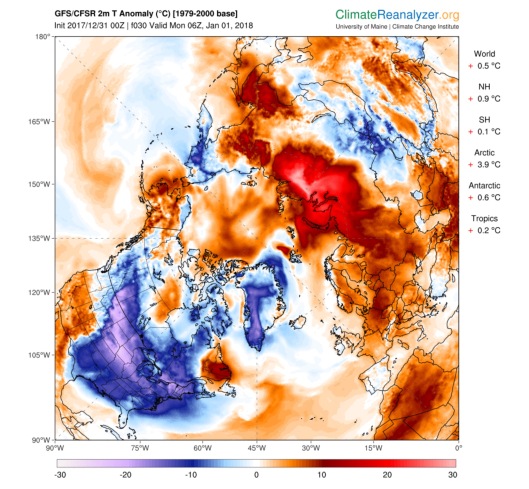
This is in degrees C (Celsius), meaning that one must multiply by 1.8 to get degrees F (Fahrenheit). So, while the Arctic average anomaly is 3.9 C (7 F), one area in Russia appears to be 30 C above average (54 F). So, if the average is minus 30 C (minus 22 F) then it may be 0 C or right at the freezing mark (32 F).

“Climate Reanalyzer
December 28 at 3:50pm ·
GFS/CFSR 10-day temperature anomaly forecast (deg F, 1979-2000 baseline). This cold wave may not be exceptional from a historical perspective (Jan 1912, Dec 1917-Jan 1918, Dec 1976, Dec 1989, Jan 1994, Feb 2015 are comparable), but it is significant for the post-2000s climate where warm winters have become the norm.
Research in the past few years suggests that extreme events such as this could be linked to Arctic warming and associated changes in atmospheric circulation.
See other forecast maps at http://cci-reanalyzer.org/wx/fcst/#gfs.na-lc.t2anom
https://www.facebook.com/ClimateReanalyzer
These maps are in degrees F. Notice the first one is January 1st and shows below average temperatures in large portions of the US and Canada, but above average temperatures in the southwest, Mexico, Alaska and parts of Canada. But, one week later it becomes above average in many of the areas which were below, with parts of Alaska very much above average.


“Temperature Anomaly Maps
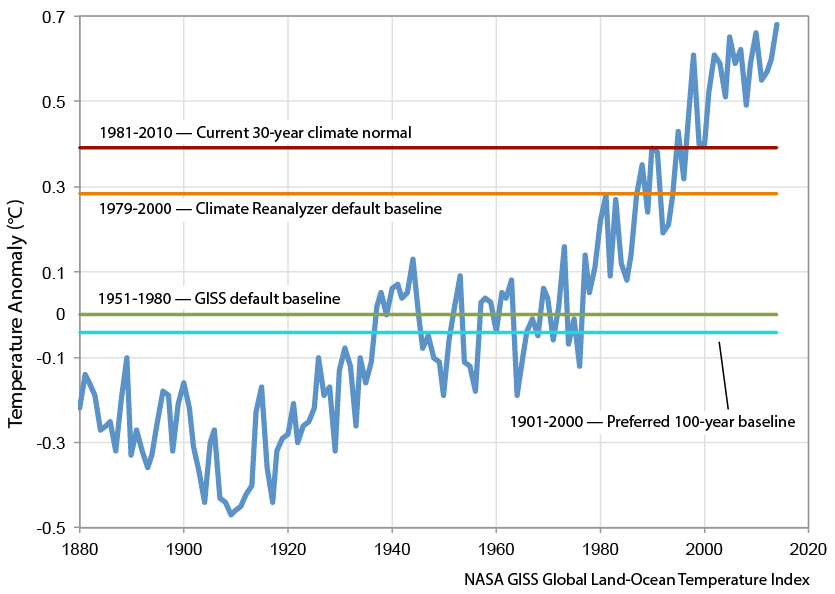
The variable Temperature 2m Anomaly is available for the GFS model. Temperature anomaly (at 2 meters above the surface) refers to the departure of the current forecasted temperature from a climate baseline. Climate Reanalyzer uses a 1979-2000 climate baseline derived from the reanalysis of the NCEP Climate Forecast System (CFSR/CFSV2). This baseline is chosen over the more typical 1981-2010 climate normal for the simple reason that it better approximates historical climatology, as shown here in relation to a 1880-2014 global land-ocean temperature index from NASA GISS.
GFS temperature anomaly maps for the World, Arctic, and Antarctic display at the right of the image a list of area-weighted average anomaly values for the World, Northern Hemisphere (Eq-90°N), Southern Hemisphere (Eq-90°S), Arctic (65°N-90°N), Antarctic (65°S-90°S), and Tropics (25°S-25°N)“.
See more information here: http://cci-reanalyzer.org/wx/fcst/#gfs.na-lc.t2anom
 http://cci-reanalyzer.org/wx/fcst/img/GISS_land+ocean_1880-2014.png
“New year could bring record low temperatures to U.S. Midwest, East Coast
Posted:Sat, 30 Dec 2017 21:09:00 -0500
(Reuters) – Bitterly cold weather will usher in the new year for much of the United States east of the Rocky Mountains this weekend, bringing record low temperatures to the Midwest, making travel difficult and putting a chill on New Year’s Eve celebrations. ” http://feeds.reuters.com/~r/reuters/environment/~3/_oC4g6gshoo/new-year-could-bring-record-low-temperatures-to-u-s-midwest-east-coast-idUSKBN1EO0LW
“New Year’s Day cold snap to hit U.S. winter wheat, rivers Posted:Fri, 29 Dec 2017 13:55:45 -0500 CHICAGO (Reuters) – A New Year’s Day cold snap in the southern U.S. Plains poses a threat to winter wheat, particularly in Kansas, the country’s biggest producer of the grain, agricultural meteorologists said“. http://feeds.reuters.com/~r/reuters/environment/~3/dCrf_ZTX9Wc/new-years-day-cold-snap-to-hit-u-s-winter-wheat-rivers-idUSKBN1EN1KS
“Western Canada ice storms cause power outages during bitter cold spell Posted:Sat, 30 Dec 2017 15:35:29 -0500 TORONTO (Reuters) – Some 36,000 homes and businesses in British Columbia lost power due to ice storms in western Canada on Saturday, and workers rushed to restore service before nightfall as forecasters predicted extremely cold temperatures across the nation. ” http://feeds.reuters.com/~r/reuters/environment/~3/8PUmxk1HB-U/western-canada-ice

You must be logged in to post a comment.