
Tags
African Americans, Baltimore, Baltimore demographics, Bureau of labor statistics, construction industry, construction sector, Construction worker demographics, construction workers, decline in unionization, demographics, employment, Foreign born, foreign workers, Francis Scott Key Bridge collapse, immigrant workers, Infrastructure bill, infrastructure funding, migrant workers, poverty, poverty rate Baltimore, unemployment, unionized workers, unions, US poverty rate, working class jobs
This blog post is in response to a propaganda piece from the Washington Post entitled: “Bridge collapse brings stark reminder of migrant workers’vulnerabilities” https://archive.is/j4dG3 The article reveals, however, that in the Baltimore and Washington [DC?] regions, immigrants comprise 39% of the workforce in the construction industry. In Baltimore City, the foreign born are 8.1% of the population.
According to the US Bureau of Labor Statistics (2022), “Non-Hispanic Blacks are underrepresented in the industry…. One in four construction industry workers are foreign born… Hispanic workers’ share of construction employment increased significantly since 2003 In 2020, 60.9 percent of those employed in the construction industry were non-Hispanic Whites, down from 71.2 percent in 2003. Hispanics accounted for another 30.0 percent in 2020, up from 20.3 percent in 2003 ” https://www.bls.gov/spotlight/2022/the-construction-industry-labor-force-2003-to-2020/
Unlike the “New Deal” WPA which provided desperately needed employment for American workers, the trillions of dollars in the infrastructure bill will disproportionately provide for foreign workers, and probably foreign construction companies/contractors. The infrastructure bill literally includes funding for at least one unneeded road to nowhere apart from immigrant detention centers, where it dead-ends, in the impoverished Mississippi Delta region. It was included to entice Senator Cindy Hyde-Smith into voting for the bill, but it didn’t work, as she apparently didn’t want an unneeded highway passing near her farm.
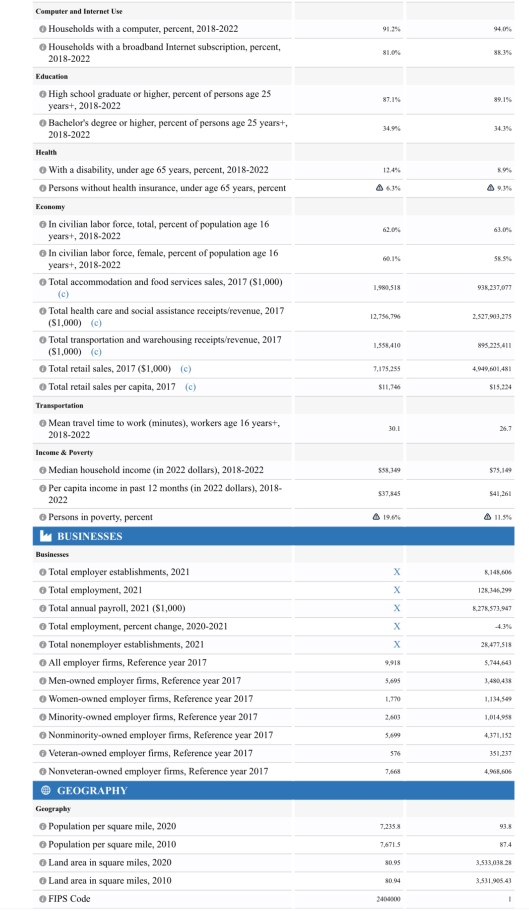
Baltimore City is 61% African-American/Non-Hispanic Black compared to 13% nationwide. The “Hispanic” population is 5.9% compared to 19.1% nationwide. The Foreign born population is 8.1% compared to 13.7% nationwide. Median (half above half below) household income for Baltimore is $58,349 compared to $75,149 nationwide. The poverty rate for Baltimore City is 19.6% compared to 11.5% nationwide. https://www.census.gov/quickfacts/fact/table/baltimorecitymaryland,US/RHI225222#RHI225222
As the following information from the Bureau of Labor Statistics shows, union membership and wages have declined in conjunction with an increase in foreign workers in the construction sector. It’s unclear if the older American workers, described below, are hold-overs from before the latest immigration waves, or if construction offers employment opportunities for those in their 50s who have lost their jobs and are otherwise unemployable.
If the immigrant workers are legal, it’s apparently illegal now to favor American workers. Is the owner of Brawner Builders, Jack Murphy, a new Irish immigrant or an Irish-American of older stock? Ireland continues to export its workers abroad, both legally and illegally, while refusing to take back earlier generations of Irish migrants, and welcoming with open arms non-Irish, non-European, immigrants, especially from the Middle East.
During the pandemic, large outdoor construction projects appear to have carried on and even increased.
Excerpts from the April 2022 article: “The Construction Industry: Characteristics of the Employed, 2003- 20” By Claire McAnaw Gallagher
“You might be surprised to learn that non-Hispanic Blacks are underrepresented in the industry…. One in four construction industry workers are foreign born…”
“Hispanic workers’ share of construction employment increased significantly since 2003
In 2020, 60.9 percent of those employed in the construction industry were non-Hispanic Whites, down from 71.2 percent in 2003. Hispanics accounted for another 30.0 percent in 2020.

“Hispanics are overrepresented in the construction industry
In 2020, 30.0 percent of construction workers were Hispanic, a share considerably higher than their 17.6-percent share of the total employed. Other racial minorities were underrepresented in the construction industry in 2020. Non-Hispanic Blacks held 5.1 percent of construction jobs, compared with their. 11.8-percent share of total employment. The Non-Hispanic Asian share of construction employment was 1.8 percent, compared with 6.2 percent of total employment.”

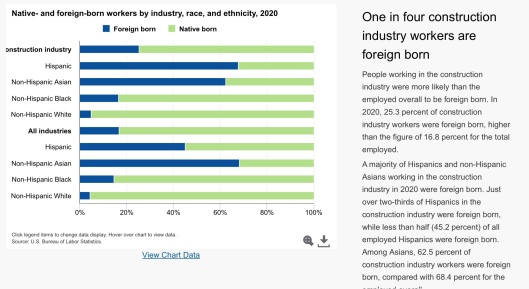
“One in four construction industry workers are foreign born
People working in the construction industry were more likely than the employed overall to be foreign born. In 2020, 25.3 percent of construction industry workers were foreign born, higher than the figure of 16.8 percent for the total employed.
A majority of Hispanics and non-Hispanic Asians working in the construction industry in 2020 were foreign born. Just over two-thirds of Hispanics in the construction industry were foreign born, while less than half (45.2 percent) of all employed Hispanics were foreign born. Among Asians, 62.5 percent of construction industry workers were foreign born, compared with 68.4 percent for the [text cutoff on website]”
“Union membership in the construction industry declined between 2003 and 2020
Since 2003, union membership overall has declined. In 2003, 8.2 percent of private wage and salary workers were union members; by 2020, the share had declined to 6.3 percent. Construction industry workers were more likely to belong to a union, but union membership in construction also declined over this period, from 16.0 percent to 12.7 percent.”

“In the construction industry, non-Hispanic Whites are most likely to be union members
For all race and ethnicity groups, construction workers were more likely to be union members than were all private wage and salary workers. Rates were higher among non-Hispanic Whites (15.2 percent) and non-Hispanic Blacks (12.7 percent) than among Hispanics (8.7 percent) and non-Hispanic Asians (7.6 percent) in 2020.”

“Native-born workers earn more than foreign-born workers across all industries
Among full-time wage and salary workers, the native born earned more than the
foreign born, both for the construction industry and for the nation overall— $1,031 versus $786 and $1,000 versus $885, respectively.
It should be noted that differences in earnings reflect a variety of factors, including variations in the distributions of foreign-born and native-born workers by educational attainment, occupation, industry, and geographic region. In addition, earnings data for 2020 reflect the effect of steep pandemic-related job losses. These data exclude incorporated, self-employed workers.”

Percent of construction workers 55 and older almost doubles
Between 2003 and 2020, the percentage of construction workers who were age 55 and over nearly doubled, from 11.5 percent to 22.7 percent. In part, this increase reflects the aging of the population. For the employed overall, the share of those age 55 and over increased from 15.4 percent to 23.9 percent over the same period. The increase was more pronounced for the construction industry, however, than for employment overall.
Nearly 1 in 3 non-Hispanic Asian construction workers were age 55 or older, considerably higher than the proportion in that age category for all employed Asians (19.4 percent).

CLICK TO ENLARGE GRAPHS. THERE ARE MANY NON-HISPANIC WHITES 55 AND OLDER TOO:
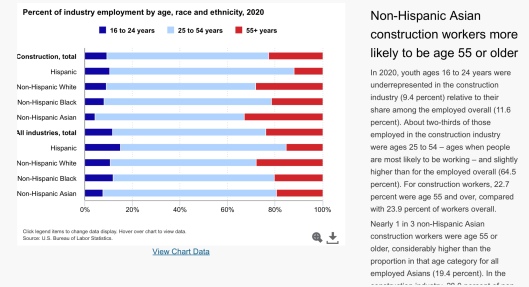
“Non-Hispanic Asian construction workers more likely to be age 55 or older
In 2020, youth ages 16 to 24 years were underrepresented in the construction industry (9.4 percent) relative to their share among the employed overall (11.6 percent). About two-thirds of those employed in the construction industry were ages 25 to 54 – ages when people are most likely to be working – and slightly higher than for the employed overall (64.5 percent). For construction workers, 22.7 percent were age 55 and over, compared with 23.9 percent of workers overall.
Nearly 1 in 3 non-Hispanic Asian construction workers were age 55 or older, considerably higher than the proportion in that age category for all employed Asians (19.4 percent).”
“Construction industry workers are generally less likely to have attended college
In 2020, over half (56.4 percent) of construction industry workers had a high school diploma or had not completed high school. This was nearly double the percentage for the employed overall (30.2 percent). Construction industry workers were much less likely than the employed overall to have a bachelor’s degree or higher—17.9 percent versus 44.1 percent.
With regard to race and ethnicity, 38.4 percent of Hispanics in the construction industry had less than a high school education, a much higher percentage than for non-Hispanic Asians, non-Hispanic Blacks, and non-Hispanic Whites. By contrast, 46.8 percent of non-Hispanic
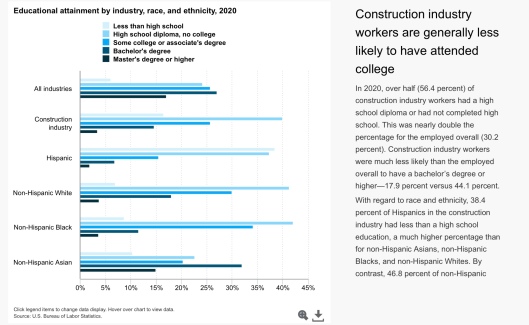
” https://www.bls.gov/spotlight/2022/the-construction-industry-labor-force-2003-to-2020/
“Bridge collapse brings stark reminder of migrant workers’ vulnerabilities” By Scott Dance and María Luisa Paúl March 27, 2024 at 7:18 p.m. EDT Washington Post “Some 130,000 immigrants work in the construction industry in the Baltimore and Washington regions, making up 39 percent of the workforce, according to Casa, a Maryland-based Latino and immigration…” https://archive.is/j4dG3
“Live Updates: Investigators Recover ‘Black Box’ Data From Baltimore Ship
Rescuers were still trying to recover the bodies of six construction workers presumed dead after the ship demolished a bridge where they were fixing potholes. The data from an on-ship recorder could help determine what went wrong”. https://archive.is/gSX3a
Baltimore City demographics vs US demographics

https://www.census.gov/quickfacts/fact/table/baltimorecitymaryland/PST045222
https://www.census.gov/quickfacts/fact/table/baltimorecitymaryland,US/RHI225222#RHI225222

You must be logged in to post a comment.